Overview
Teaching: 10 min Exercises: 0 minQuestions
What other geospatial visualization tools should I know about?
Objectives
See how Tableau, GeoViews, and other tools can be used in a data workflow.
Sometimes, complex plotting tools in Python aren’t precisely the best tool for the job, especially if “the job” is quick and dirty visualization, a more public-facing product, or a visualizing a huge data set. Here I list a couple of other tools which could be useful for other geospatial visualization tasks.
Tableau
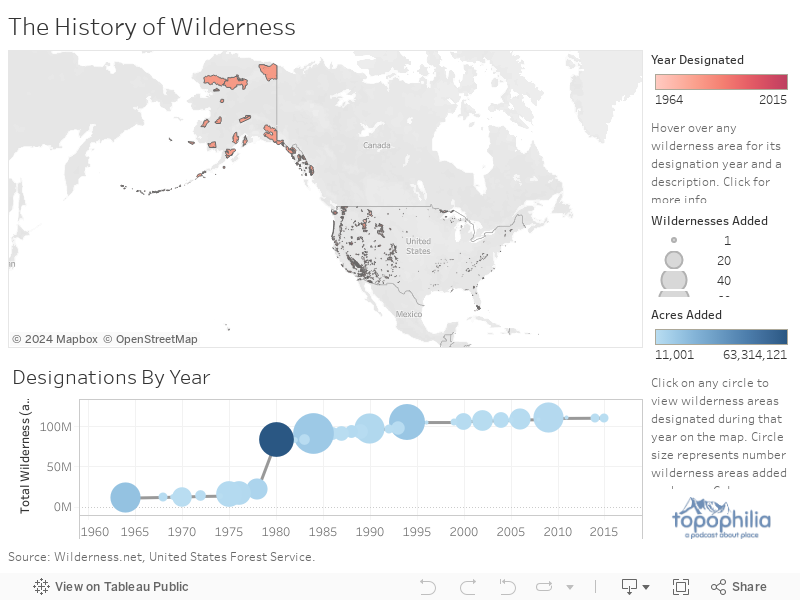
Tableau is a robust data visualization software tool, used by businesses, governments, and researchers for myriad data viz purposes. Recently, it has experienced a large growth in geospatial capability. The strength of Tableau is creating visually appealing demonstrations of complicated data in an easy-to-use software program. Here’s an example of a Tableau geospatial visualization showing the history of Wilderness designation in the U.S.:
Holoviews + Geoviews + Datashader
Dealing with a huge quantity of geospatial data, and want an interactive visualization? Holoviews is a very powerful data-aware Python visualization library, and has a geospatial component called GeoViews. They have a great set of tutorials, including one about creating fast, easy to use maps with huge numbers of data points.
Key Points