Geospatial Data Visualization
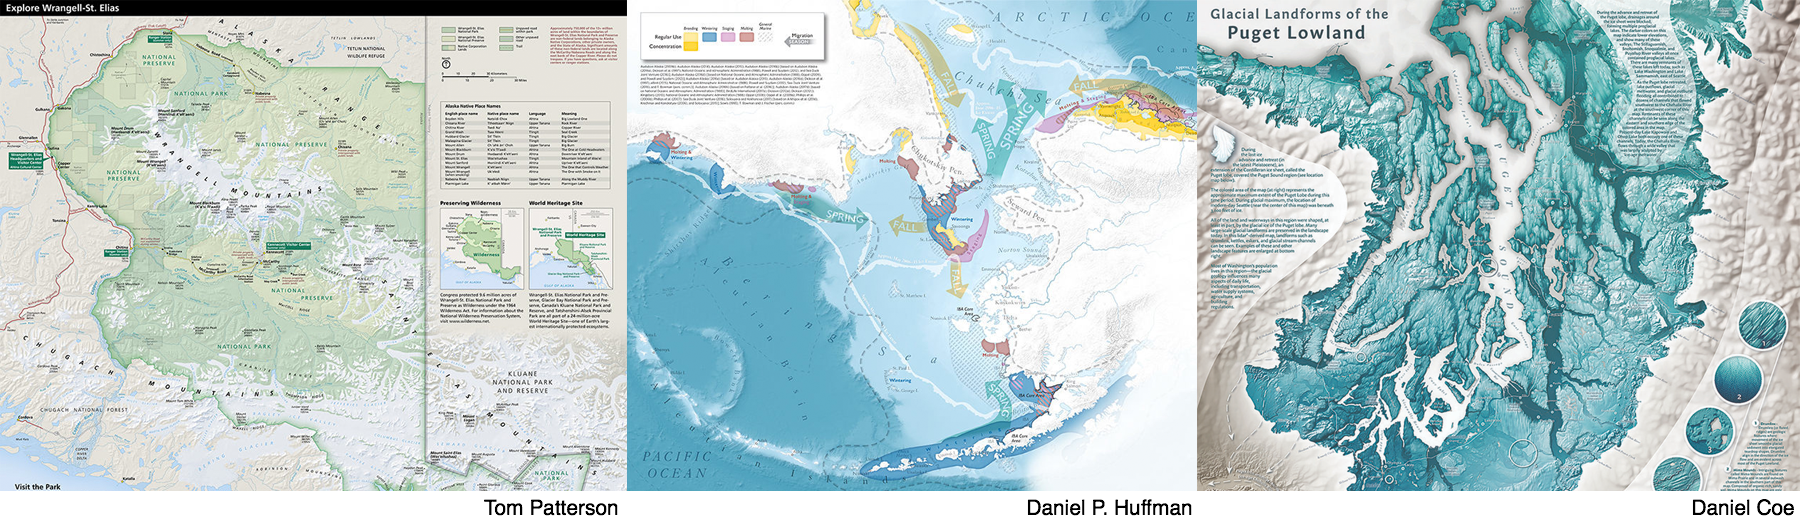
2018 NACIS Atlas of Design submissions
The purpose of this tutorial is to 1) foster a working knowledge of basic geospatial visualization tools in Python and 2) expose participants to the wide landscape of spatial visualization tools, both programmatic (using code, e.g. cartopy) and graphical (by clicking, e.g. Tableau, ArcGIS). It is based on the lesson template used in Data Carpentry
and Software Carpentry workshops and was written by Tony Cannistra with lesson development by Tony and Randy LeVeque.
Schedule
| 09:00 | Introduction |
What is data visualization, really?
What are the roles of visualization in the geospatial data analysis pipeline? |
| 09:05 | Basics: Projections | How do map projections work? How can Python help me manage them? |
| 09:25 |
Basics: Quick + Simple maps with cartopy.
|
What is cartopy? How can it help with visualization?
How do I create a simple map in Python? |
| 09:45 |
Plotting Actual Things: geopandas and cartopy
|
How do I see my {shapefile/KML/GPX/GeoJSON} file on a map?
How do I control the styles and other parameters of a Cartopy plot? |
| 10:00 | Interactive Maps |
How do I create a map I can interact with using Python?
What packages are available for this? |
| 10:15 | Other Powerful Plotting Tools | What other geospatial visualization tools should I know about? |
| 10:25 | Finish |