Overview
Teaching: 20 min Exercises: 0 minQuestions
How do map projections work? How can Python help me manage them?
Objectives
The Earth is Round
There are lots of ways to make it flat.
The Earth is Round
|
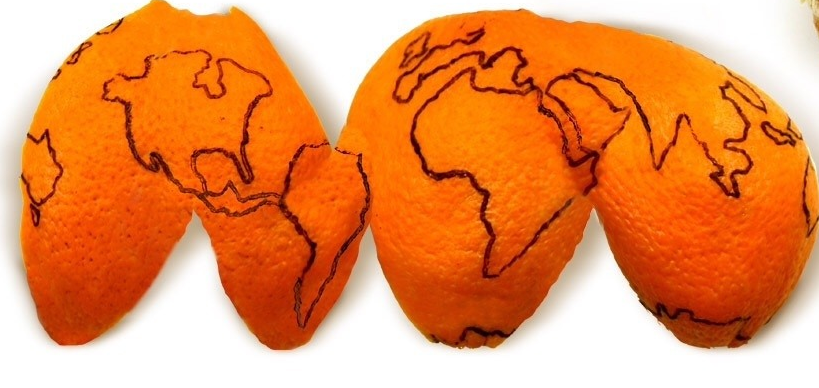
| Flattened Orange (e.g. Goode Homolosine projection) |
The Earth is round (ok, ellipsoidal), paper and computer screens are flat. This means that when we attempt to flatten our round planet to the two-dimensional plane of websites and journal articles, we make certain assumptions based on the intent we’ve set for our map.
For example: perhaps being able to compare area across the globe is critical (i.e. a two-cm square anywhere on our paper map has the same surface area on the globe), or perhaps preserving the ‘real’ shapes of landmasses is important. Each set of assumptions and tradeoffs we create is referred to as a “projection,” and consists of a set of equations which convert spherical (or, in the case of Earth, ellipsoidal) coordinates into planar coordinates.
Those “spherical coordinates” I mention above are referencing a location on a sphere (or, in the case of Earth, an elipse), and as such they have to be in reference to some definition of that sphere. We call that reference point a datum, which defines the surface upon which the unprojected spherical coordinates lie. There are several important datums, like WGS84 (used by GPS systems) and NAD83, which you’ll see often. They each define a different version of the Earth’s geometry, and that’s all we’ll say about that here (it’s easy to get into a rabbit hole with datums/geographic reference systems, so we’ll avoid that). For more on this, start at this discussion (thanks Randy for the reference!).
Each of these projections has been assigned a code by the European Petroleum Survey Group (EPSG), which has established itself as a projection authority. This has made using specific projections quite simple, as one can refer to them by their EPSG code. The EPSG code for the Web Mercator projection (used by Google Maps and Bing Maps), for example, is EPSG:3857. You can explore projections and find your neighborhood’s favorite at http://epsg.io.
Some Examples (comic):
|
 |

|
| Mercator (web maps) | Lambert Conformal Conic (weather maps) | Winkel-Tripel (National Geographic maps) |
See here for a nice visualization of different projections by github user syntagmatic.
EPSG Codes
Each of these projections has been assigned a code by the European Petroleum Survey Group (EPSG), which has established itself as a projection authority. This has made using specific projections quite simple, as one can refer to them by their EPSG code. The EPSG code for the Web Mercator projection (used by Google Maps and Bing Maps), for example, is EPSG:3857. You can explore projections and find your neighborhood’s favorite at http://epsg.io, which is also the database cartopy uses to lookup projections by their EPSG codes.
This Sounds Complicated!
It is. Fortunately, much of the work to manage these map projections, at least in Python, has been done for us. In the next episode in this tutorial we’ll use cartopy to help turn a standard Python plotting tool into a powerful, projection-aware mapping utility.
Key Points
Map projections are interesting, complicated, and mostly handled for us.
Choosing a projection appropriately to match the intent of the visualization is critical to accurately conveying information (“how much distortion is OK?”).