Overview
Teaching: 5 min Exercises: 0 minQuestions
What is data visualization, really?
What are the roles of visualization in the geospatial data analysis pipeline?
Objectives
Develop an understanding of the value of learning data visualization tools.
Develop an understanding of the role of data viz in the geospatial researcher’s data pipeline.
What is Visualization? (stolen shamelessly from Dr. Jeffrey Heer’s course slides)
- “Transformation of the symbolic into the geometric” [McCormick et al. 1987]
- “… finding the artificial memory that best supports our natural means of perception.” [Bertin 1967]
- “The use of computer-generated, interactive, visual representations of data to amplify cognition.” [Card, Mackinlay, & Shneiderman 1999]
Why Visualization?
- Answer questions (or discover them)
- Make decisions
- See data in context
- Expand memory
- Support graphical calculation
- Find patterns
- Present argument or tell a story
- Inspire
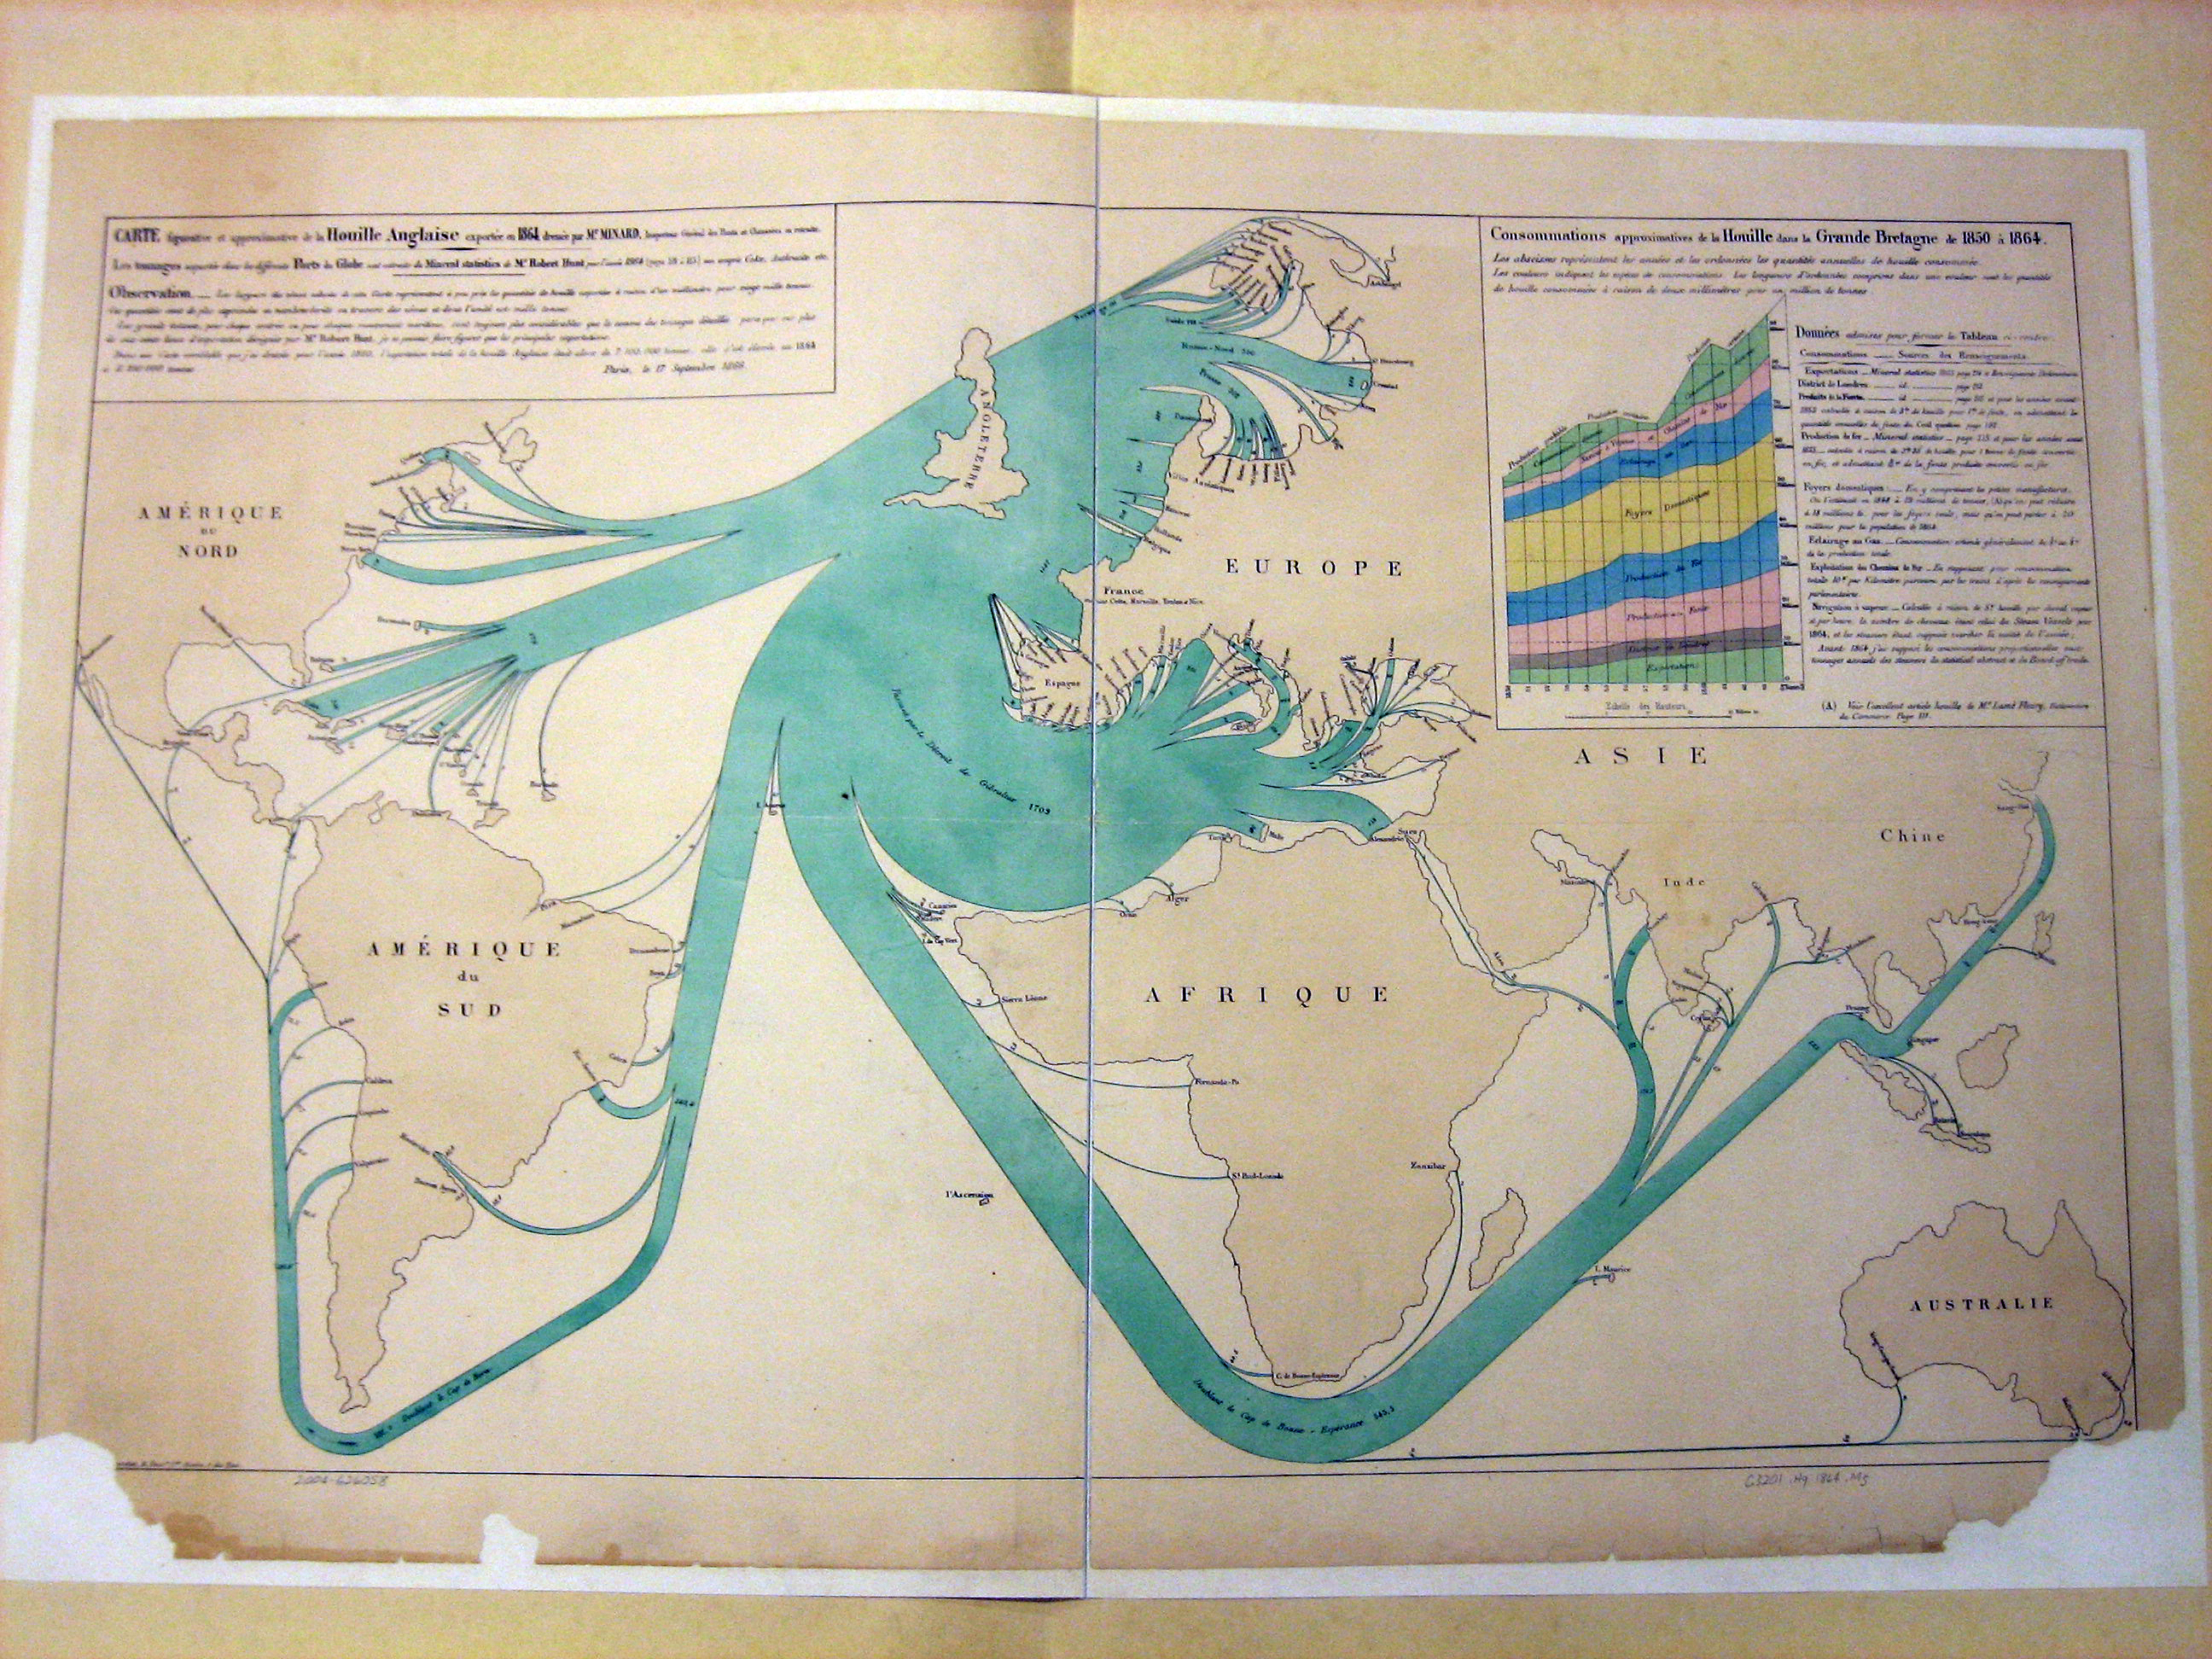
 Coal Exports, 1864. Charles Minard
 Napoleon’s 1812 Russian campaign, Charles Minard (1869)
Key Points
Visualizing data augments human cognition and, if done right, can lead to richer understanding of the available data.
Cartographic visualizations (maps) can draw significant insights from spatial data.
Data visualization is a tool to assist several steps of the researcher’s pipeline, from initial data exploration to communication of final results.