Overview
Teaching: 10 min Exercises: 0 minQuestions
When do we need to use multidimensional arrays?
What are current challenges is manipulating these datasets?
Objectives
explore how most people currently handle these types of datasets
discuss how current methods are limiting the science that can be accomplished
Overview:
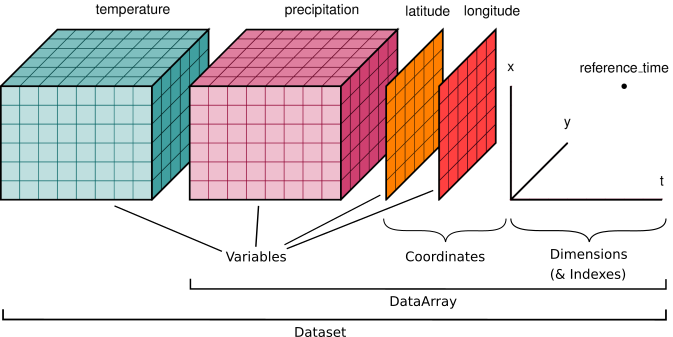
Unlabelled, N-dimensional arrays of numbers, such as NumPy’s ndarray, are the most widely used data structure in scientific computing. Geoscientists have a particular need for structuring their data as arrays. For example, we commonly work with sets of climate variables (e.g. temperature and precipitation) that vary in space and time and are represented on a regularly-spaced grid. Often we need to subset a large global grid to look at data for a particular region, or select a specific time slice. Then we might want to apply statistical functions to these subsetted groups to generate summary information.

Isn’t this the same as raster processing?
The tools in this tutorial have some similarity to raster image processing tools. Both require computational engines that can manipulate large stacks of data formatted as arrays. Here we focus on tools that are optimized to handle data that have many variables spanning dimensions of time and space. See the raster tutorials for tools that are optimized for image processing of remote sensing datasets.
Conventional Approach: Working with Unlabelled Arrays
Multidimensional array data are often stored in user-defined binary formats, and distributed with custom Fortran or C++ libraries used to read and process the data. Users are responsible for setting up their own file structures and custom codes to handle these files. Subsetting the data involves reading everything into an in-memory array, and then using a series of nested loops with conditional statements to look for a specific range of index values associated with the temporal or spatial slice needed. Also, clever use of matrix algebra is often used to summarize data across spatial and temporal dimensions.
Challenges:
The biggest challenge in working with N-dimensional arrays in this fashion is the fact that the data are almost disassociated from their metadata. Users are left with the task of tracking the meaning behind array indices using domain-specific software, often leading to inefficiencies and errors. Common pitfalls often occur in in the form of questions like “is the time axis of my array in the first or third index position?”, or “does my array of timestamps still align with my data after resampling?”.
The network Common Data Format
The network Common Data Form, or netCDF, was created in the early 1990s, and set out to solve some of the challenges in working with N-dimensional arrays. Netcdf is a collection of self-describing, machine-independent binary data formats and software tools that facilitate the creation, access and sharing of scientific data stored in N-dimensional arrays, along with metadata describing the contents of each array. Netcdf was built by the climate science community at a time when regional climate models were beginning to produce larger and larger output files. Another format, HDF5, has been used for many applications including distribution of remote sensing datasets. It turns out these two formats are now merging, such that the latest version netCDF-4 is the HDF5 format but with some restrictions.
One benefit of Common Data Formats is that they are structured in ways that enable rapid subsetting and analysis using simple command line tools. For example, the climate community has developed their own netCDF toolkits that accomplish tasks like subsetting and grouping. Similar tools exist for HDF5. Therefore many researchers utilize these tools exclusively in their analysis.
NetCDF in practice
NetCDF has been widely adopted as a standard format for distributing N-dimensional arrays. Although many geoscience communities rely entirely on existing NetCDF software tools for processing and visualizing their data, others simply use NetCDF as a convenient format for serializing their arrays. In many applications, existing NetCDF tools do not provide the flexibility needed for a specific research question, and users end up reading arrays into memory. They then perform statistical and subsetting operations using conventional coding methods (e.g. looping over array indices) described above.
Handling large arrays
The NetCDF format has no limit on file sizes. However, any analysis tools that read data from a NetCDF array into memory for some computational operation will be limited by that particular machine’s available memory. As many multidimensional datasets grown in size, for example due to increases in model resolution and remote sensing capabilities, we are becoming increasingly limited in our ability to handle these large datasets.
Key Points
unlabelled, N-dimensional arrays of numbers (e.g. NumPy’s ndarray) are the most widely used data structure in scientific computing
these arrays lack meaningful metadata, so users must track indices in an arbitrary fashion
in-memory operations, needed to process and visualize large arrays, are reaching limits as datasets grow in size